Week 3 Updates
- Bradley Schulz
- Jan 30, 2023
- 7 min read
Putting the pieces together!
Goals from This Past Week
Team goals: Work on pre-processing so we have a standardized way of reducing noise in the cards.
Personal goals: Be able to classify the shape, number of shapes, fill, and color of a card.
Summary of Image Processing Pipeline
Working with Tyler, we combined our work from previous weeks to outline the process of image classification. The following steps describe how we process an image to get classify each card present:
Take image from camera
Convert to grayscale
Gaussian blur
Threshold (ideally using adaptive thresholding)
Erode and dilate to smooth out noise
Find outline of each card (by finding the contours in the image)
Identify corners of each card so we can transform them to a standardized 60x90 rectangle
Identify the shapes on the card (through finding contours)
Transform each shape into a 40x20 rectangle, with one rectangle corresponding to one shape on the card.
Count the number of shapes on the card.
Calculate the average area of the shapes on the card to classify the type of shape.
Analyze the RGB values in the shapes to identify color and fill
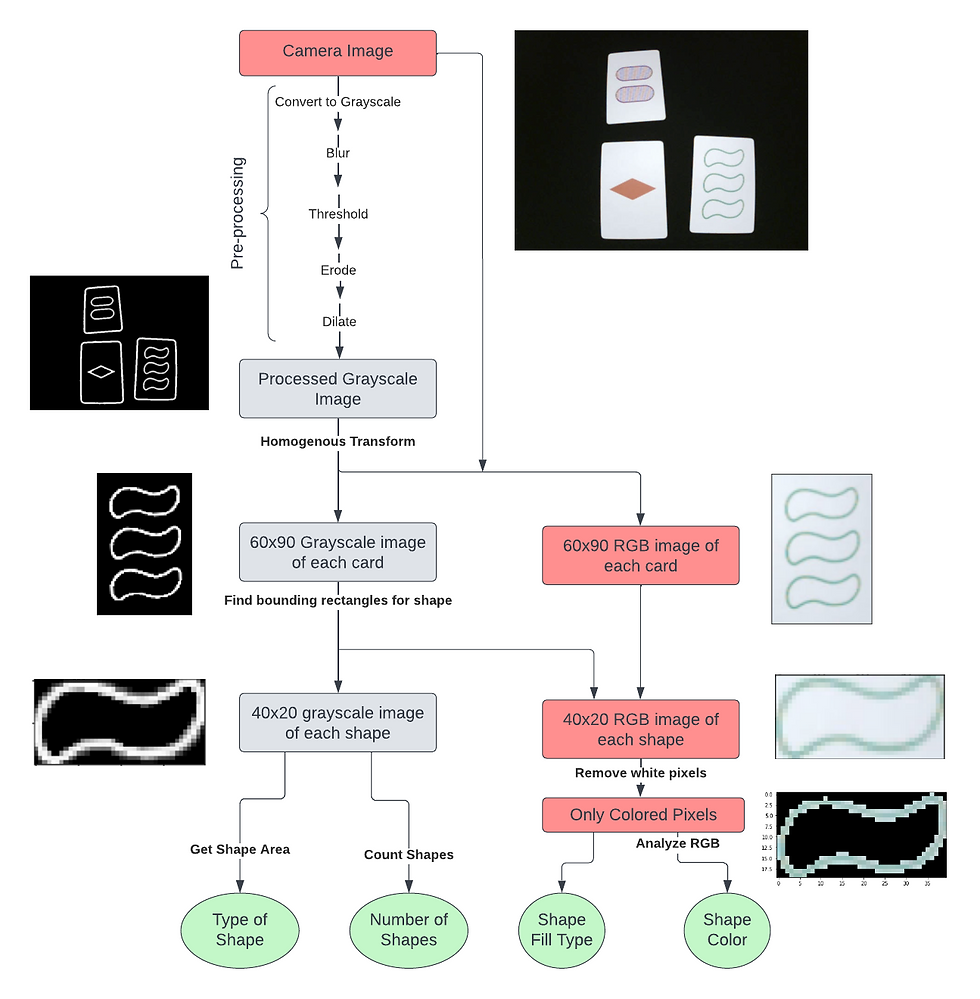
My tasks begin with the 60x90 images of each card. I take the pre-processed image from Tyler (blurred, eroded, dilated, and thresholded) and analyze the patterns on that image. I also receive the points corresponding to the corners of each card in the original image so I can use the RGB version to analyze the color and fill of each card.
Classification Steps
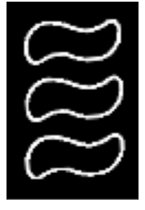
The image processing on a card begins with a thresholded image of a card that looks as follows. Using the thresholded image (meaning that each pixel is either a 1 or 0), makes processing the shapes significantly easier.
In all of these processes, I aimed to make the system as simple as possible. Since this will ultimately be running on an embedded system, I wanted to prioritize simple if-else statements over more complicated classification methods like neural networks.
Shape Type
As outlined in the week 2 blog post, the shape is determined using the area enclosed by the outline of the shape in the grayscale image.
To get a bounding rectangle around each shape, I used OpenCV's findContours() method. Since there may be gaps in the shape outline (due to noise), I combine bounding rectangles that overlap or are within 3 pixels of each other. I also ignore all rectangles that are less 30 pixels wide and 15 pixels tall to remove small dots of noise.
The image below illustrates the process of combining nearby bounding rectangles. The red rectangles are the raw contours, and the green ones are the final ones.
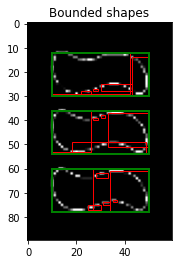
Once I have each shape, I find the area and use the following algorithm to classify the shape based on the area:
if area < 450: shape_type = DIAMONDS elif area < 650: shape_type = SQUIGGLES else: shape_type = OVALS
Number of Shapes
Identifying the number of shapes is very easy once the bounding rectangles around the shapes is determined, as I simply count the number of bounding rectangles.
This can be done in one line after finding the bounding rectangles around each shape:
num_shapes = len(shapes)
Shape Color
Color is more complicated than I initially thought due to variations in lighting between images. In the end, I decided to use the ratio of red, blue, and green in the non-white pixels to identify the color of the shapes on the card (red, green, and purple).
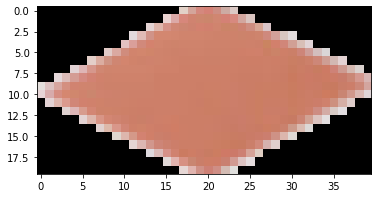
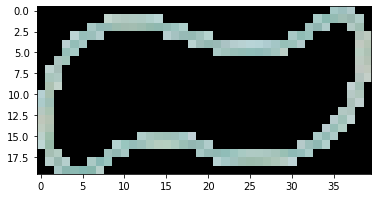
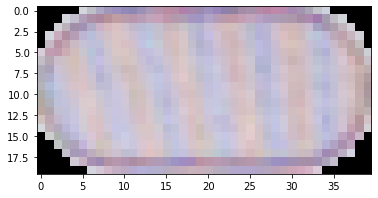
I first isolate all the non-white pixels in the image. I do this by taking the average RGB values of the 4 pixels in the bottom right and top left of the image, as these are always white for every shape. Then I remove every pixel whose sum of RGB values are within 5% of these. What is left are images that look like the following:
From there I count the number of pixels left and take their average R, G, and B values. From my testing, I found the following algorithm gives 95% accuracy on the training data set
RED_THRESH = 1.2 GREEN_THRESH = 2
def classify_color(shape_info: Tuple[red, green, blue]) -> Color: if red / green > RED_THRESH and red / blue> RED_THRESH: return RED elif green / red + green / blue > GREEN_THRESH: return GREEN else: return PURPLE
This algorithm first checks if the color is red, since I found this one as the easiest to detect. It identifies red cards as those where the colored pixels have 20% more red than both blue and green. Then it checks for green by seeing if the sum the ratios of the average green-to-red and green-to-blue pixel values is greater than 2. Lastly, it defaults to purple. I put purple as the default color since it is a mixture of red and blue and therefore the hardest to isolate to a specific criterion.
Shape Fill
To determine fill, I used a couple of techniques. These are based on the following observations:
Empty cards do not have many colored pixels since most of them are white.
Striped cards have less variation between RGB values since more of the pixels are white (or closer to white). The whiter the pixel, the more similar the red, green, and blue values
I already have the number of colored pixels from the previous step, and I can use that information to identify shapes that are not filled. I use a threshold of 300 colored pixels to differentiate between empty and non-empty shapes. This gave 99% accuracy in the training data set.
For the cards that do not meet this threshold of non-white pixels, I take the standard deviation between the red, green, and blue values for each colored pixel in the image. Since striped cards have pixels that are both white and colored while shapes that have a solid fill are more consistent, the standard deviation of the RGB values on the solid filled cards is significantly more (as one color is much more prominent).
# Identify empty shapes if avg_filled < 300: fill = Fill.EMPTY else: # Use standard deviation to differentiate solid vs striped
# color_info contains the information for each shape on the card
# c[4] is the standard deviation of the RGB values in each shape rgb_std = np.mean([c[4] for c in color_info]) # Solid fill has more variation (less white) if rgb_std > 14: fill = Fill.SOLID else: fill = Fill.STRIPED
Training Steps
The steps I took to learn to classify the type of shape are in last week's blog post, but here is how I generated the classification criteria for the color of the card and the fill of the shapes.
I found all the processes and thresholds above through analyzing 5 sample images of each of the 81 cards (for a total of 400+ cards) from this training set on GitHub. Using the images of each shape with the white pixels removed, I found the following information about each shape in the images:
Average red value across all colored pixels
Average green value across all colored pixels
Average blue value across all colored pixels
Number of colored pixels
Average standard deviation between the R, G, and B values in each pixel
Once I had this information, I could run various tests across the entire dataset while isolating specific colors and fill types.
For color classification, I separated out the data into three arrays corresponding to each color. Then I found the mean, min, and max of the red:green, red:blue, and green:blue ratios of the pixels:
RED CARDS           Avg     Min     Max
Red green ratios:   4.2929  1.1221  33.4716
Red blue ratios:    4.2956  0.9398  41.8526
Green blue ratios:  1.0046  0.5567  3.7049

GREEN CARDS
Red green ratios:   0.5669  0.0527  1.1385
Red blue ratios:    0.7307  0.1157  2.0713
Green blue ratios:  1.5516  0.8721  3.4412

PURPLE CARDS
Red green ratios:   1.6962  0.8157 5.4302
Red blue ratios:    0.8750  0.3956 1.7898
Green blue ratios:  0.6308  0.1183 1.0897
I followed a similar process for analyzing fill, except by using the standard deviation between each pixel's red, green, and blue values rather than the ratio of these values.
Reflection on Week 3 Goals
Before starting this project, we set our week three goals as the following:
Have a working algorithm that can classify an image of a card
Be able to successfully read data from the camera on to the H7
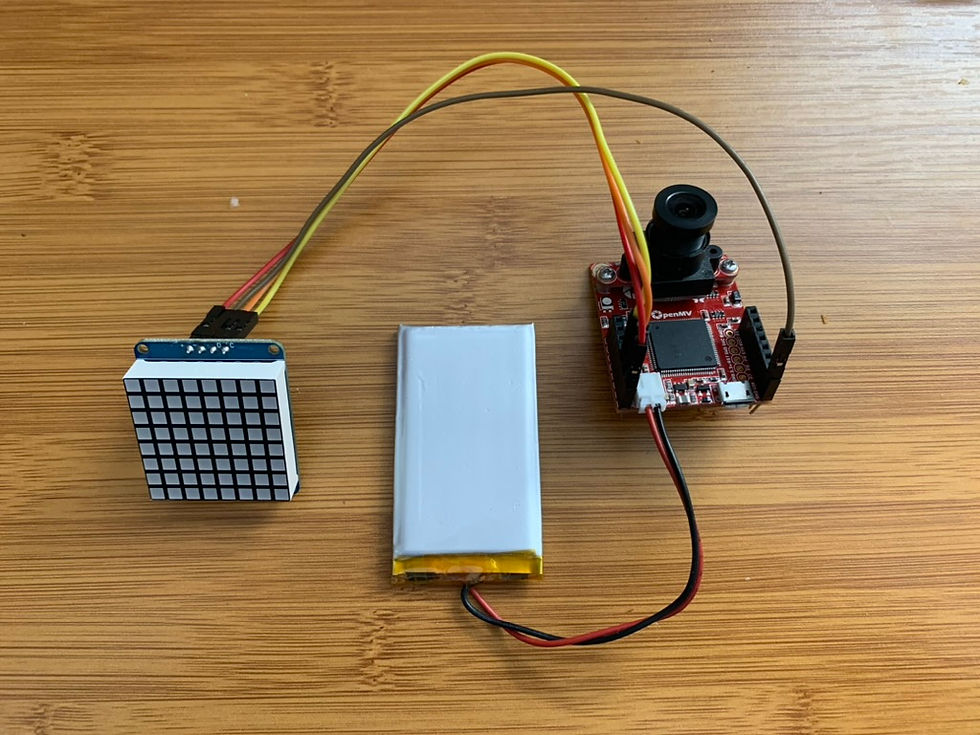
We successfully achieved both of these goals, as our code can take information from the camera connected to the H7, segment the cards, and classify the cards based on the shapes, number of shapes, color, and fill of the patterns on the card.
The code that we have starts with an image like this, taken with a camera controlled with the H7:

To generate classifications such as this:
Card has 1 Color.RED Fill.SOLID Shape.DIAMONDS
Card has 3 Color.GREEN Fill.EMPTY Shape.SQUIGGLES
Card has 2 Color.PURPLE Fill.STRIPED Shape.OVALS
Next Steps
We discovered that OpenCV, the Python library that does most of our image processing, has not been implemented in MicroPython (the language we are using to run code on the H7). To fix this, we may need to re-implement the following OpenCV algorithms:
Gaussian blur
Thresholding
Finding contours (although this may be replaced with corner detection)
Identifying bounding rectangles from contours
Perspective (aka homogenous) transform
Image resizing
However, Tyler and I are holding off on reimplementing these algorithms until we have a chance to more thoroughly test our end-to-end classification system. That way, we can know which functions we actually require. There are also some approximate functions already available, so we need to double check the available functions to see what we can use from MicroPython.
Week 7 Goals
The next milestone is week 7. As per our original proposal, the goals for week 7 are to have an:
Algorithm for combined segmentation and classification complete and ported over to H7
LED matrix is built and controllable through the H7
Given our progress so far, these goals are definitely within reach. If we have extra time, I want to put more effort into optimizing our algorithm to increase the speed. Currently, there are a lot of calculations required to classify the cards. Ideally, the system would refresh very quickly to maintain a very current description of the game.
Goals for Next Week
Team goals: Get the combined classification system functioning on the H7
Personal goals: Re-implement any functions that are not automatically included by default on MicroPython.





OK, see you Thursday. Perhaps Do a White Balance to help with identifying colors?